Welcome to my Solar & Sky Watch page—a dedicated space where I monitor activity in our solar system and beyond. Using a combination of Python scripts and data from NASA and other scientific institutions, I track asteroids, comets, solar activity, and planetary positions. Feel free to explore the scripts below and run them yourself if you’d like to keep an eye on the skies.
What I Monitor
☄️ Asteroids & Comets (NASA Scout Data)
The first script pulls real-time data from NASA’s Scout API, which continuously monitors the Minor Planet Center’s NEO Confirmation Page. Scout identifies new near-Earth objects (NEOs) and assesses their potential impact risk. The script displays:
-
Object ID and type (asteroid or comet)
-
Risk level (Low, Moderate, High, or Warning)
-
Estimated size based on absolute magnitude (H)
-
Speed and distance from Earth (in Lunar Distances)
-
Objects flagged as Potentially Hazardous Asteroids (PHAs)
If any object has a risk score, it is highlighted separately. The script also provides a summary of how many NEOs and PHAs are currently being tracked.
🧲 Solar Activity & Geomagnetic Storms (KP Index Forecast)
The second script forecasts geomagnetic activity by retrieving the planetary K-index (KP) from GFZ Potsdam or NOAA. The KP index measures disturbances in Earth’s magnetic field caused by solar wind. This is particularly useful for:
-
Aurora borealis hunters (high KP = better chances of seeing the Northern Lights)
-
Radio amateurs and satellite operators
-
Anyone interested in space weather
The script presents a forecast for the next 3–9 days, including:
-
KP index values (0–9)
-
Activity level (from Quiet to Extreme Storm)
-
Storm warnings when KP reaches 5 or higher
🌍 Planetary Position and Distance from Oslo
The third script uses the Skyfield astronomy library to calculate the exact position and distance of celestial objects as seen from Oslo, Norway. You can enter any major solar system body—such as the Moon, Sun, Jupiter, or Saturn—and a specific date and time. The script returns:
-
Distance in Astronomical Units (AU)
-
Right ascension and declination (equatorial coordinates)
This is a handy tool for planning observations or simply satisfying curiosity about where a particular planet is right now.
🌍 Planetary Brightness from Oslo
The fourth script calculates the apparent magnitude (brightness) of planets as seen from Oslo using NASA’s JPL Horizons system. While the previous script shows you where to find a planet in the sky, this one tells you how bright it will appear—essential information for planning observations with binoculars or telescopes.
The script connects directly to the JPL Horizons database, which is the same system used by professional astronomers and spacecraft navigators worldwide. For each major planet in our solar system, it returns:
-
Apparent magnitude (lower numbers = brighter objects)
-
Current distance from Oslo in Astronomical Units (AU)
This is particularly useful for:
-
Determining which planets are visible to the naked eye
-
Planning astrophotography sessions
-
Tracking how a planet’s brightness changes over time as it orbits the Sun
Why I Built This
I have always been fascinated by what moves in the space around us – whether it is a distant comet, a potentially hazardous asteroid, or the solar storms that paint the sky with auroras. These scripts are my way of staying connected to the cosmos, and I hope they inspire you to look up as well.
All scripts are written in Python and use open data from NASA, NOAA, and other research institutions. You are welcome to download, modify, and run them on your own machine.
Scripts
Below you will find the Python scripts I use for monitoring. Simply copy the code, save it as a .py file, and run it in your terminal (ensure you have the required libraries installed).
Script 1: Asteroids & Comets (NASA Scout Data)
#!/usr/bin/env python3
"""
Enkelt program for å vise status for asteroider og kometer.
Henter data fra NASA Scout (https://ssd-api.jpl.nasa.gov/doc/scout.html)
"""

import requests
from datetime import datetime

def get_scout_data():
    """Hent data fra NASA Scout API"""
    url = "https://ssd-api.jpl.nasa.gov/scout.api"

    try:
        response = requests.get(url, timeout=10)
        response.raise_for_status()
        return response.json()
    except requests.exceptions.RequestException as e:
        print(f"Feil ved henting av data: {e}")
        return None

def format_risk_level(score):
    """Konverter risikoscore til lesbart nivå"""
    if score is None:
        return "Ingen"
    try:
        s = float(score)
        if s < 0.5:
            return "Lav 🌕"
        elif s < 2.0:
            return "Moderat 🌖"
        elif s < 5.0:
            return "Høy 🌗"
        else:
            return "Spesiell 🌘"
    except (ValueError, TypeError):
        return "Ukjent"

def calculate_size_from_H(H):
    """Beregn omtrentlig størrelse fra absolutt magnitude (H)"""
    if not H:
        return "?"
    try:
        # Standard formel: diameter (km) = 1329 / sqrt(albedo) * 10^(-H/5)
        # Antar albedo = 0.14 (typisk for asteroider)
        H_val = float(H)
        diameter_km = 1329 / 0.374 * 10**(-H_val/5)  # 1329/sqrt(0.14) ≈ 1329/0.374
        diameter_m = diameter_km * 1000

        if diameter_m < 10:
            return f"{diameter_m:.0f}m"
        elif diameter_m < 1000:
            return f"{diameter_m:.0f}m"
        else:
            return f"{diameter_m/1000:.1f}km"
    except:
        return "?"

def vis_asteroid_status():
    """Hovedfunksjon som viser status for asteroider og kometer"""
    print("\n" + "="*80)
    print("ASTEROID- OG KOMETOVERSIKT - NASA SCOUT")
    print("="*80)
    print(f"Data hentet: {datetime.now().strftime('%Y-%m-%d %H:%M:%S UTC')}")
    print("Kilde: NASA/JPL Center for NEO Studies (CNEOS)")
    print("\nScout overvåker Minor Planet Center sin NEO Confirmation Page 24/7")
    print("="*80)

    # Hent data fra Scout API
    data = get_scout_data()

    if not data or 'data' not in data:
        print("\nFEIL: Kunne ikke hente data fra NASA Scout")
        return

    print(f"\nAntall objekt under overvåking: {len(data['data'])}")
    print("\n" + "-"*80)
    print(f"{'Nr':<4} {'Objekt ID':<12} {'Type':<10} {'Risiko':<15} {'Størrelse':<12} {'H':<6} {'Fart':<8} {'Avstand':<10}") print("-"*80) interesting = [] for i, obj in enumerate(data['data'], 1): # Objekt ID obj_id = obj.get('objectName', f'Obj_{i}') # Type (basert på ID og data) obj_type = "Asteroide" if obj_id and ('P/' in obj_id or 'C/' in obj_id): obj_type = "Komet" elif obj.get('neoScore', 0) and obj.get('neoScore', 0) > 50:
            obj_type = "NEO*"

        # Risikoscore - håndter None-verdier
        risk_score = obj.get('rating')
        risk_level = format_risk_level(risk_score)

        # Størrelse fra H-verdi
        H = obj.get('H', '?')
        size = calculate_size_from_H(H)

        # Fart (vInf)
        speed = obj.get('vInf', '?')
        speed_str = f"{speed} km/s" if speed != '?' else '?'

        # Avstand til jorden (caDist) i Lunar Distance
        distance = obj.get('caDist', '?')
        dist_str = f"{distance} LD" if distance != '?' else '?'

        print(f"{i:<4} {obj_id:<12} {obj_type:<10} {risk_level:<15} {size:<12} {H:<6} {speed_str:<8} {dist_str:<10}") # Samle interessante objekt (med rating > 0)
        if risk_score and float(risk_score) > 0:
            interesting.append(obj)

    print("-"*80)

    # Vis objekt med risikoscore
    if interesting:
        print("\n" + "!"*80)
        print("OBJEKTER MED RISIKOSCORE:")
        print("!"*80)
        for obj in sorted(interesting, key=lambda x: float(x.get('rating', 0) or 0), reverse=True):
            obj_id = obj.get('objectName', 'Ukjent')
            rating = obj.get('rating', 0)
            H = obj.get('H', '?')
            speed = obj.get('vInf', '?')
            print(f"  • {obj_id}: Rating {rating} - H={H}, Fart={speed} km/s")
        print("!"*80)
    else:
        print("\nIngen objekt med risikoscore funnet.")

    # Vis statistikk
    neo_count = sum(1 for o in data['data'] if o.get('neoScore', 0) and o.get('neoScore', 0) > 50)
    pha_count = sum(1 for o in data['data'] if o.get('phaScore', 0) and o.get('phaScore', 0) > 0)

    print("\n" + "="*80)
    print("STATISTIKK:")
    print(f"  • NEO-objekt (neoScore > 50): {neo_count}")
    print(f"  • Potensielt farlige (phaScore > 0): {pha_count}")
    print(f"  • Med risikoscore: {len(interesting)}")
    print("="*80)

    print("\nForklaring:")
    print("  🌕 Lav risiko - Normal overvåking")
    print("  🌖 Moderat risiko - Krever oppfølging")
    print("  🌗 Høy risiko - Prioriteres for observasjon")
    print("  NEO* = Near-Earth Object (nærjordsobjekt)")
    print("  LD = Lunar Distance (1 LD ≈ 384,400 km)")
    print("  H = Absolutt magnitude (lavere tall = større objekt)")
    print("="*80)

if __name__ == "__main__":
    vis_asteroid_status()
Script 2: Solar Activity & Geomagnetic Storms (KP Index Forecast)
#!/usr/bin/env python3
import requests
import pytz
from datetime import datetime, timedelta

def get_kp_forecast():
    """Hent KP-indeks prognose fra GFZ Potsdam eller NOAA"""
    # KP interpretation mapping
    kp_levels = [
        (1, "Very Quiet"), (2, "Quiet"), (3, "Quiet"), (4, "Unsettled"),
        (5, "Unsettled"), (6, "Active"), (7, "Minor Storm"),
        (8, "Moderate Storm"), (9, "Storm")
    ]

    def interpret_kp(kp):
        return next((level for threshold, level in kp_levels if kp < threshold), "Extreme Geomagnetic Storm") def parse_gfz(data): if not data or not isinstance(data.get("forecast"), list): return None return [{ "timestamp": datetime.fromisoformat(e["time"]).strftime("%Y-%m-%d %H:%M:%S UTC"), "kp_index": float(e["kp"]), "activity": interpret_kp(float(e["kp"])) } for e in data["forecast"] if e.get("time") and e.get("kp")] # Vi prøver GFZ Potsdam først, og hvis det feiler, prøver vi NOAA for url in [ "https://kp.gfz-potsdam.de/app/json/forecast", "https://services.swpc.noaa.gov/products/noaa-planetary-k-index-forecast.json" ]: try: resp = requests.get(url, timeout=5) resp.raise_for_status() data = resp.json() if "gfz-potsdam" in url: forecasts = parse_gfz(data) else: # NOAA forecasts = [{ "timestamp": f"{e[0]} UTC", "kp_index": float(e[1]), "activity": interpret_kp(float(e[1])) } for e in data[1:] if len(e) >= 2]

            if forecasts:
                days = 9 if "gfz-potsdam" in url else 3
                return {
                    "forecast_period": {
                        "start": datetime.now(pytz.UTC).strftime("%Y-%m-%d"),
                        "end": (datetime.now(pytz.UTC) + timedelta(days=days)).strftime("%Y-%m-%d")
                    },
                    "kp_forecast": forecasts
                }
        except: continue
    return None

def vis_kp_prognose():
    """Vis KP-indeks prognose i terminalen"""
    print("\n" + "="*80 + "\nKP INDEX FORECAST\n" + "="*80)

    forecast = get_kp_forecast()
    if not forecast:
        print("\nFEIL: Kunne ikke hente KP prognose\nSjekk internettforbindelsen og prøv igjen")
        return

    print(f"\nPrognoseperiode: {forecast['forecast_period']['start']} til {forecast['forecast_period']['end']}")
    print("\n" + "-"*80)
    print(f"{'Dato':<12} {'Tid (UTC)':<15} {'KP':<6} {'Aktivitet':<20} {'Varsling':<10}")
    print("-"*80)

    storm_warnings = []
    warning_map = {5: "⚠️ MINOR", 6: "⚠️ MODERATE", 7: "⚠️ STRONG", 8: "⚠️ SEVERE", 9: "⚠️ SEVERE"}

    for entry in forecast['kp_forecast']:
        date_part, time_part = entry['timestamp'].split(' ', 1) if ' ' in entry['timestamp'] else (entry['timestamp'], "")
        kp, activity = entry['kp_index'], entry['activity']

        warning = warning_map.get(int(kp), "")
        if warning:
            storm_warnings.append(f"{date_part} {time_part}: {warning} STORM (KP {kp})")

        print(f"{date_part:<12} {time_part:<15} {kp:<6.1f} {activity:<20} {warning:<10}")

    print("-"*80 + ("\n\n" + "!"*80 + "\nSTORVARSLER:\n" + "!"*80 + "\n  " +
          "\n  ".join(storm_warnings) + "\n" + "!"*80 if storm_warnings else "\n\nIngen stormvarsler i prognoseperioden"))

    print("\n" + "="*80 + "\nForklaring:\n  KP 0-1: Quiet (Stille)\n  KP 2-4: Unsettled/Active (Urolig/Aktivt)"
          "\n  KP 5:   Minor Storm (Liten storm)\n  KP 6:   Moderate Storm (Moderat storm)"
          "\n  KP 7:   Strong Storm (Sterk storm)\n  KP 8-9: Severe/Extreme Storm (Alvorlig/Ekstrem storm)\n" + "="*80)

if __name__ == "__main__":
    vis_kp_prognose()
Installation under Windows:
PS C:\Users\david> pip install requests pytz
Script 3: Planetary Position and Distance from Oslo
Her we use Skyfield. Skyfield itself is not a database but a “Python library” that downloads specific data files from different sources . This model consists of:
- Library/Layer = Are the tool that accesses and processes data= We can use Skyfield (Python library)
- Data Files = Are flat files downloaded to your local machine = We can use `de421.bsp`, `finals2000A.all`
- Data Sources = Are the official providers of the raw data = We can use NASA JPL, IERS
- Convenience Package = Are bundles data files for easy installation = We use her the`skyfield-data`
from skyfield.api import load, Topos, utc
from datetime import datetime

class astro_calculator:
    def __init__(self):
        pass

    def get_object_distance_and_position(self, object_name, date):
        try:
            planets = load('de421.bsp')
            earth, sun, moon = planets['earth'], planets['sun'], planets['moon']

            if object_name == 'moon':
                celestial_body = moon
            elif object_name == 'sun':
                celestial_body = sun
            elif object_name == 'jupiter':
                celestial_body = planets['JUPITER BARYCENTER']
            elif object_name == 'saturn':
                celestial_body = planets['SATURN BARYCENTER']
            elif object_name == 'uranus':
                celestial_body = planets['URANUS BARYCENTER']
            elif object_name == 'neptune':
                celestial_body = planets['NEPTUNE BARYCENTER']
            else:
                try:
                    celestial_body = planets[object_name]
                except KeyError:
                    raise ValueError("Ugyldig objektnavn!")

            ts = load.timescale()
            t = ts.utc(datetime.strptime(date, "%Y-%m-%d %H:%M:%S").replace(tzinfo=utc))

            # Beregn for Oslo (59.91° N, 10.75° Ø)
            oslo = earth + Topos('59.91 N', '10.75 E')
            astrometric_oslo = oslo.at(t).observe(celestial_body)
            distance_oslo = astrometric_oslo.distance().au
            ra_oslo, dec_oslo, _ = astrometric_oslo.radec()

            return distance_oslo, (ra_oslo, dec_oslo)

        except Exception as e:
            print(f"Feil i get_object_distance_and_position: {e}")
            raise

if __name__ == "__main__":
    calculator = astro_calculator()

    objekt_navn = input("Skriv himmellegeme (f.eks. 'moon', 'sun'): ").strip().lower()
    dato_tid = input("Skriv dato og tid (ÅÅÅÅ-MM-DD TT:MM:SS): ").strip()

    try:
        avstand, posisjon = calculator.get_object_distance_and_position(objekt_navn, dato_tid)
        ra, dec = posisjon

        print(f"\n--- Resultater for {objekt_navn} sett fra Oslo ---")
        print(f"Avstand: {avstand:.6f} AU")
        print(f"Posisjon:")
        print(f"  Rektascensjon: {ra}")
        print(f"  Deklinasjon: {dec}")

    except Exception as e:
        print(f"\nFeil: {e}")
Library requirements:
You much download the file de421.bsp. The file should be in the same directory as your python program.
# pip3 install skyfield
or
# pip install skyfield
Script 4: Planetary Brightness from Oslo (JPL Horizons)
from astroquery.jplhorizons import Horizons
from astropy.time import Time

def calculate_brightness_horizons_oslo(planet_id):
    """Calculate the apparent magnitude of a planet using JPL Horizons, using ID and Oslo as observer."""

    try:
        # Oslo coordinates: Latitude 59.9139° N, Longitude 10.7522° E
        obj = Horizons(id=planet_id, location='59.9139 N, 10.7522 E', epochs=Time.now().jd)
        eph = obj.ephemerides()

        if eph is None or len(eph) == 0:
            return f"Could not retrieve ephemerides for ID {planet_id}."

        magnitude = eph['V'].data[0]
        distance_au = eph['delta'].data[0]

        print(f"Distance to ID {planet_id} from Oslo: {distance_au:.4f} AU")

        return magnitude

    except Exception as e:
        return f"Error retrieving data for ID {planet_id}: {e}"

# Example usage
planet_ids = [199, 299, 499, 599, 699, 799, 899]
planet_names = ["Mercury", "Venus", "Mars", "Jupiter", "Saturn", "Uranus", "Neptune"]

for i in range(len(planet_ids)):
    brightness = calculate_brightness_horizons_oslo(planet_ids[i])
    print(f"Apparent magnitude of {planet_names[i]} from Oslo: {brightness}")
# pip install astroquery astropy
About the numbers: In astronomy, apparent magnitude is a logarithmic scale—lower numbers mean brighter objects. Venus can reach magnitude -4.9 (extremely bright), while Neptune hovers around magnitude +7.8 (requiring binoculars or a small telescope).
Understanding planet IDs: JPL Horizons uses specific numeric identifiers for celestial bodies. The ones I use here are:
-
199: Mercury
-
299: Venus
-
499: Mars
-
599: Jupiter
-
699: Saturn
-
799: Uranus
-
899: Neptune
Notes
-
Data is updated regularly, but always check the official sources for critical information.
-
The asteroid script uses NASA’s Scout API—some objects may be very new and have limited data.
-
For the KP forecast, I prioritize GFZ Potsdam data (9-day forecast) but fall back to NOAA (3-day forecast) if necessary.
-
The planetary position script uses the DE421 ephemeris from NASA JPL.
🔭 Professional Astronomy Application (Qt GUI)
Beyond these command-line scripts, I’ve also developed a full-featured desktop application for serious astronomy work. Built with Python and Qt, this professional tool brings together multiple data sources into an intuitive graphical interface.
Key Features:
-
📊 Real-time NEO Monitoring – Visual dashboard of near-Earth objects with color-coded risk levels
-
🌌 Interactive Sky Charts – Pan and zoom to explore celestial objects from Oslo’s perspective
-
📈 Space Weather Dashboard – Live KP-index graphs with aurora probability forecasts
-
🔍 Object Database – Quick access to thousands of asteroids, comets, and planets
-
📸 Observation Planner – Log and plan your viewing sessions
The application demonstrates how Python’s scientific stack (NumPy, Pandas, Astropy) can be combined with Qt’s powerful GUI framework to create professional-grade astronomy software.
Below are screenshots showing the different options in one of my applications (running on my Mac workstation):
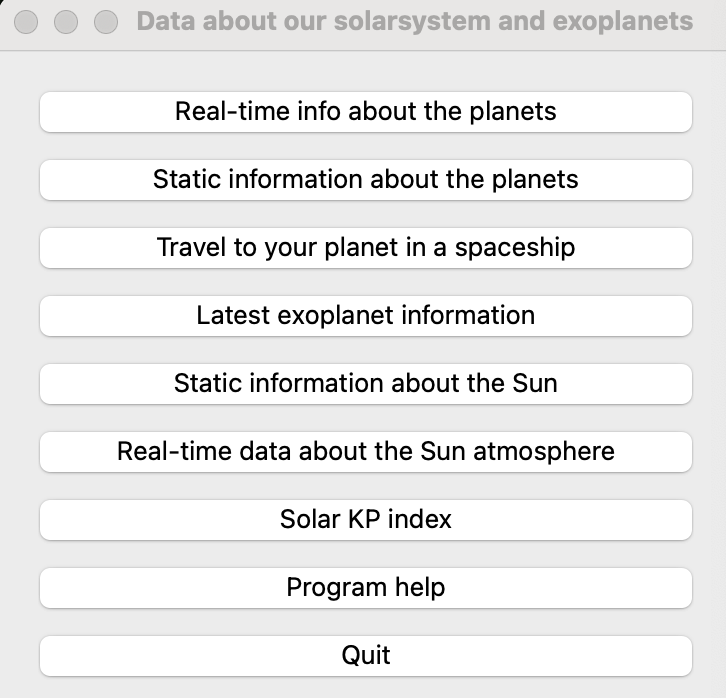
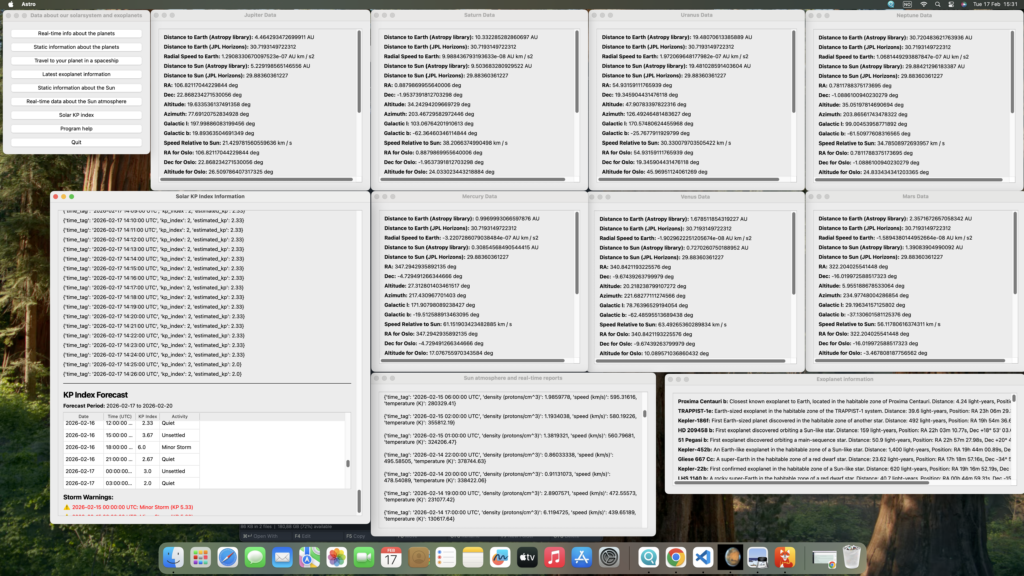 .
.
Whether you’re a fellow developer interested in the code or an astronomer looking for a capable desktop tool, feel free to reach out. The application is continuously evolving as I add new features and data sources.
Clear skies and happy coding! ☀️🔭✨